The stack
Five ways to read one mine.
Two optical passes seven years apart, shortwave infrared, radar and terrain, over the same 250 km² on one 12.5 m grid.
Sentinel-2 · Sentinel-1 · Copernicus DEM
Industry · Mining
A new cut, a dump outside the plan, a stockpile that grew. MineScope reads optical, radar and terrain over a mine and hands a person the few places that need a look.
17.10° S · 70.63° W · 250 km²
The stack
Two optical passes seven years apart, shortwave infrared, radar and terrain, over the same 250 km² on one 12.5 m grid.
Sentinel-2 · Sentinel-1 · Copernicus DEM
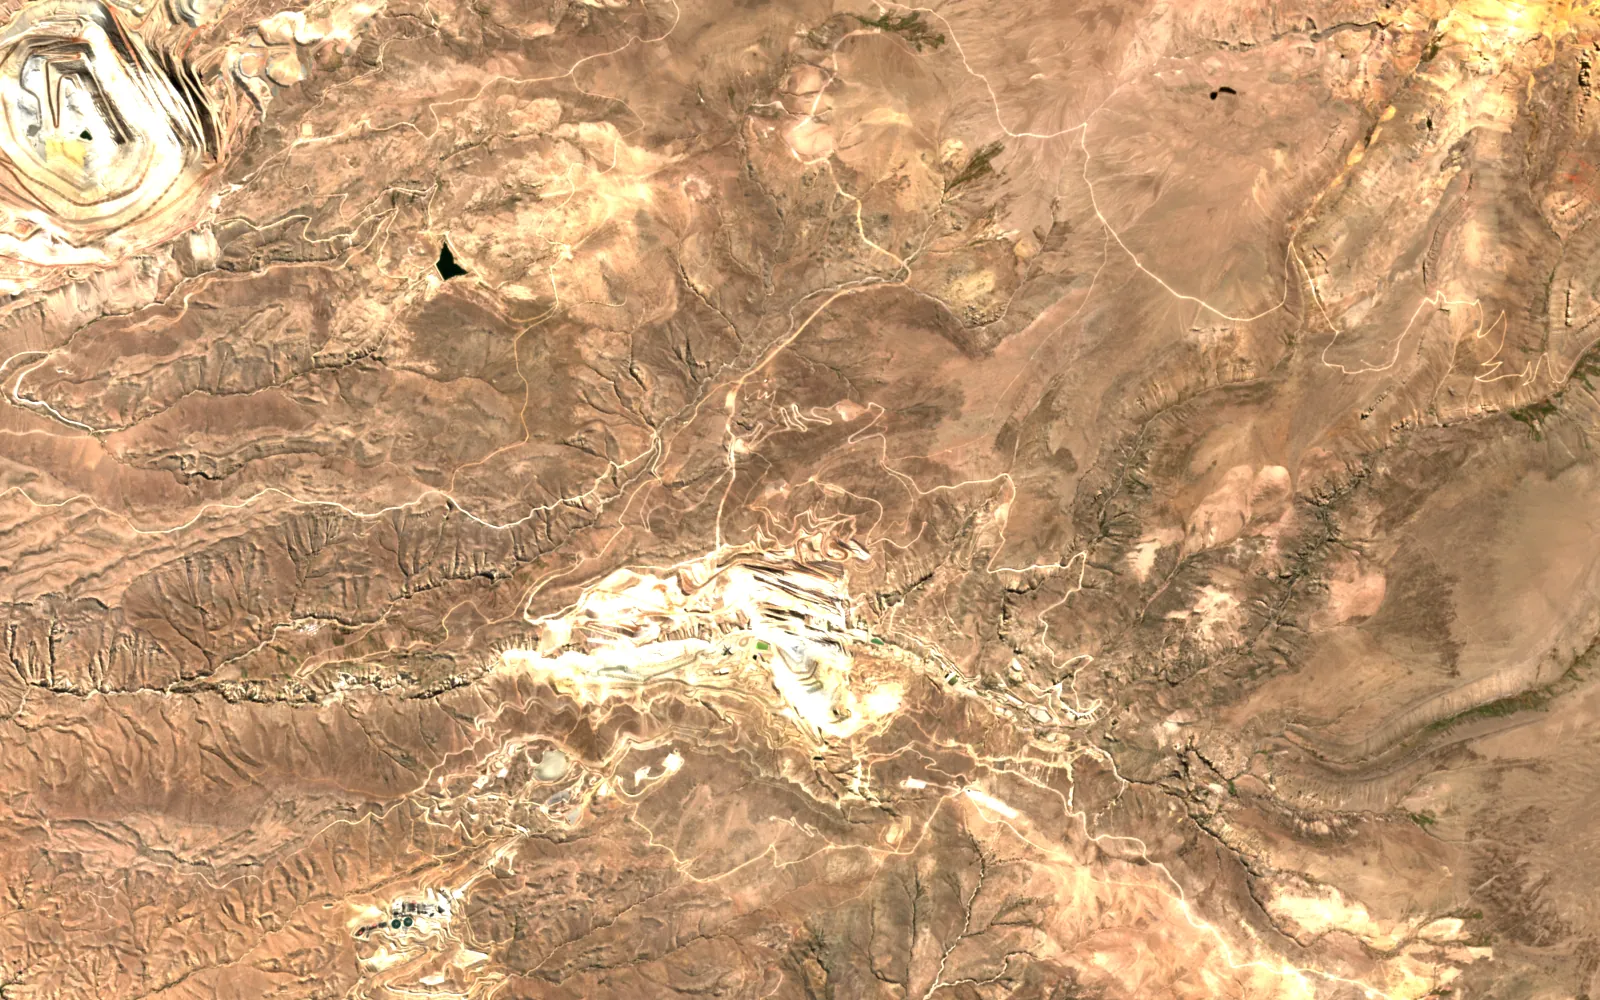
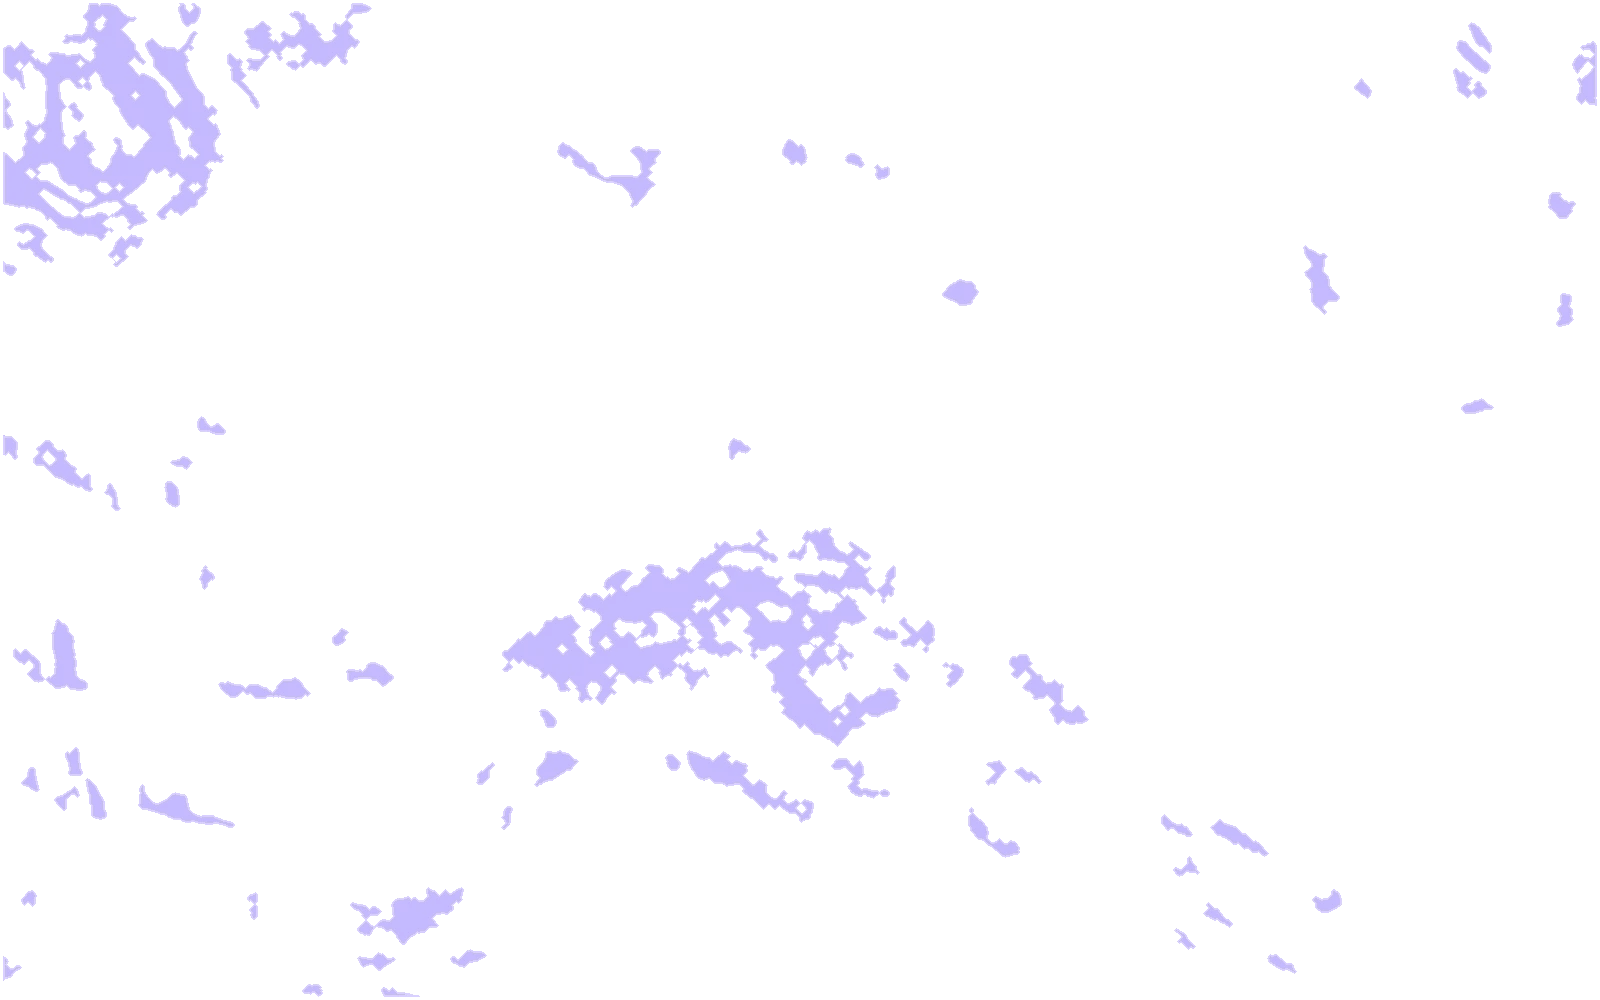
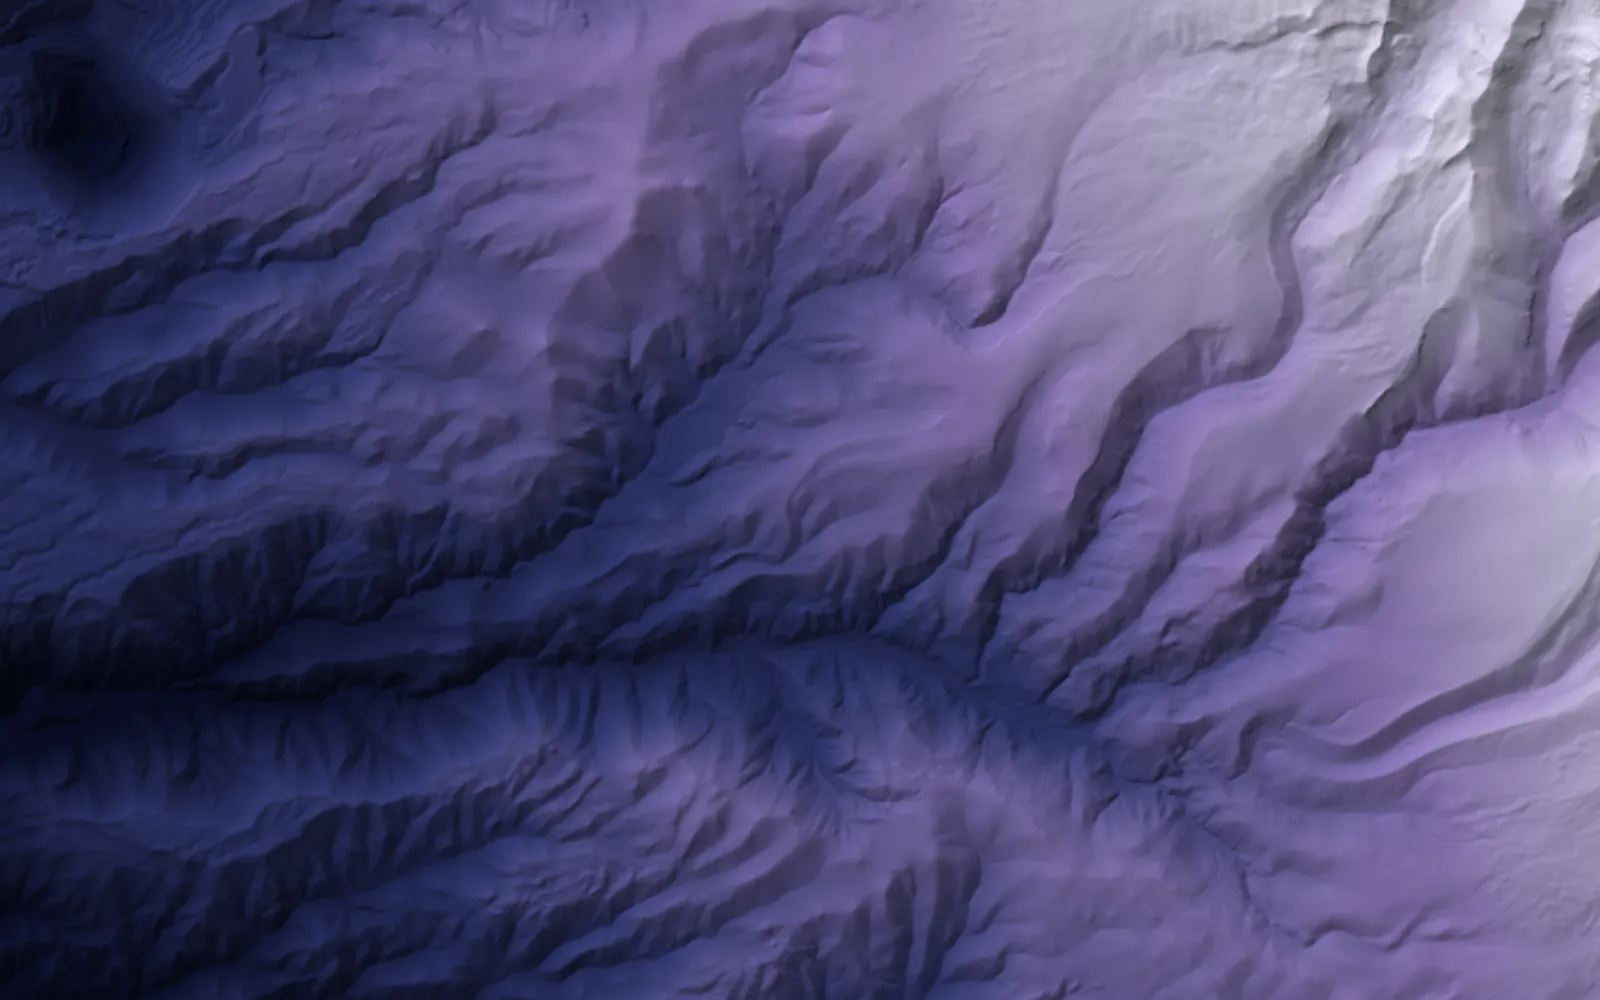 Terrain
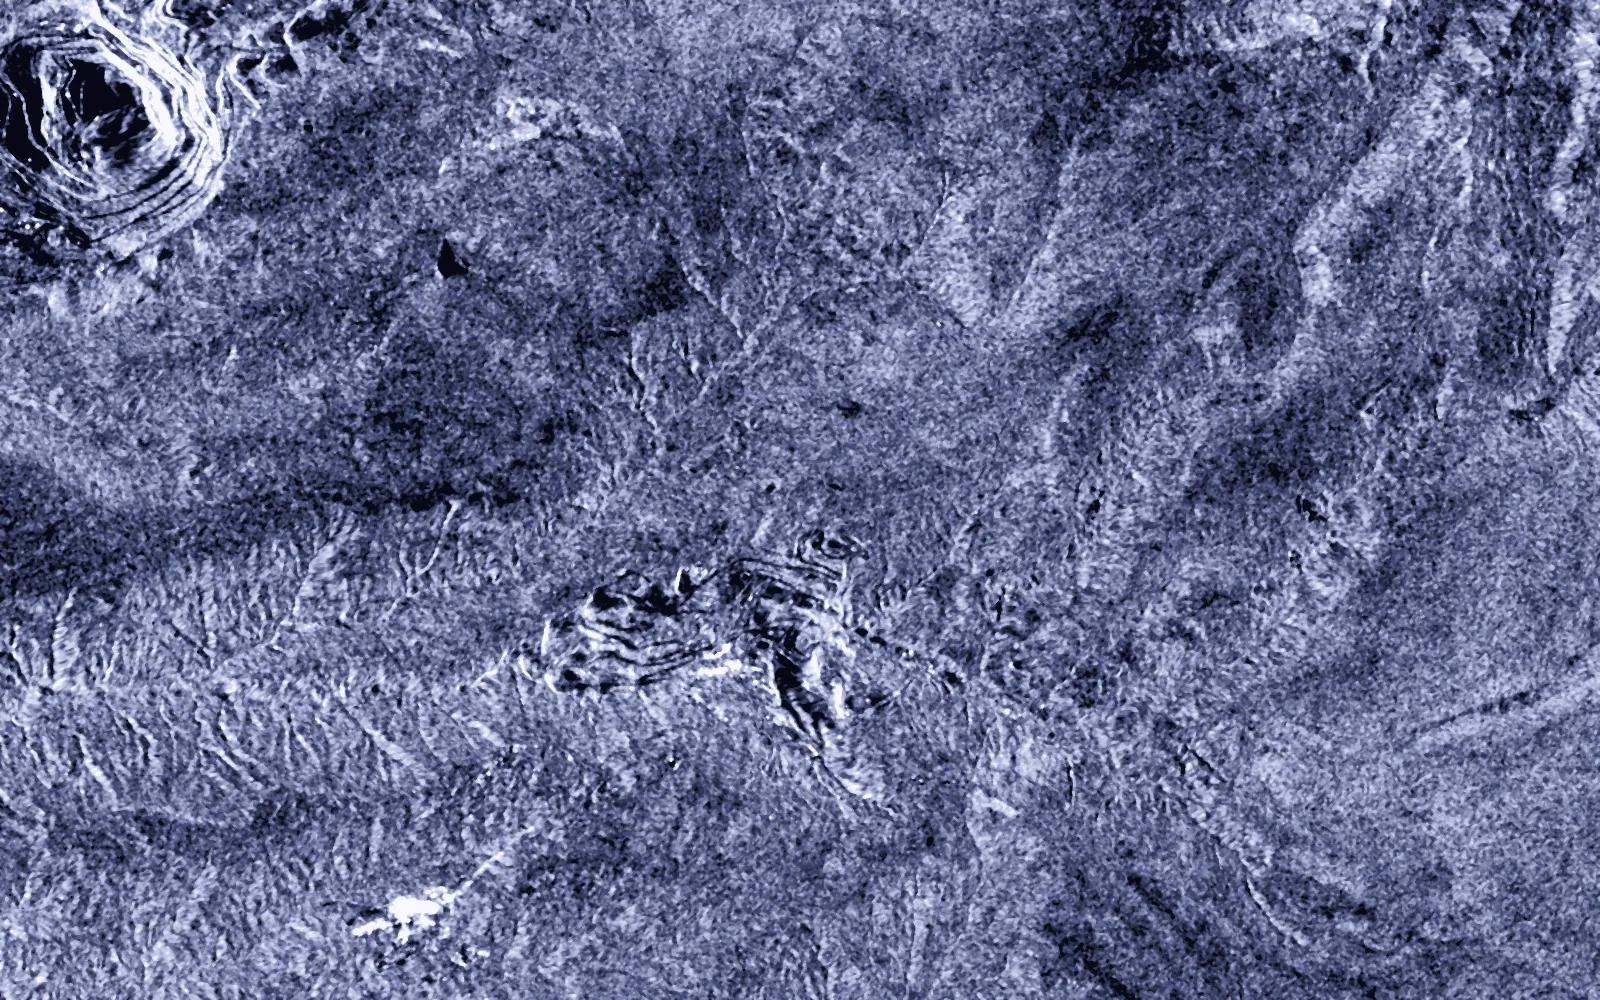 Radar
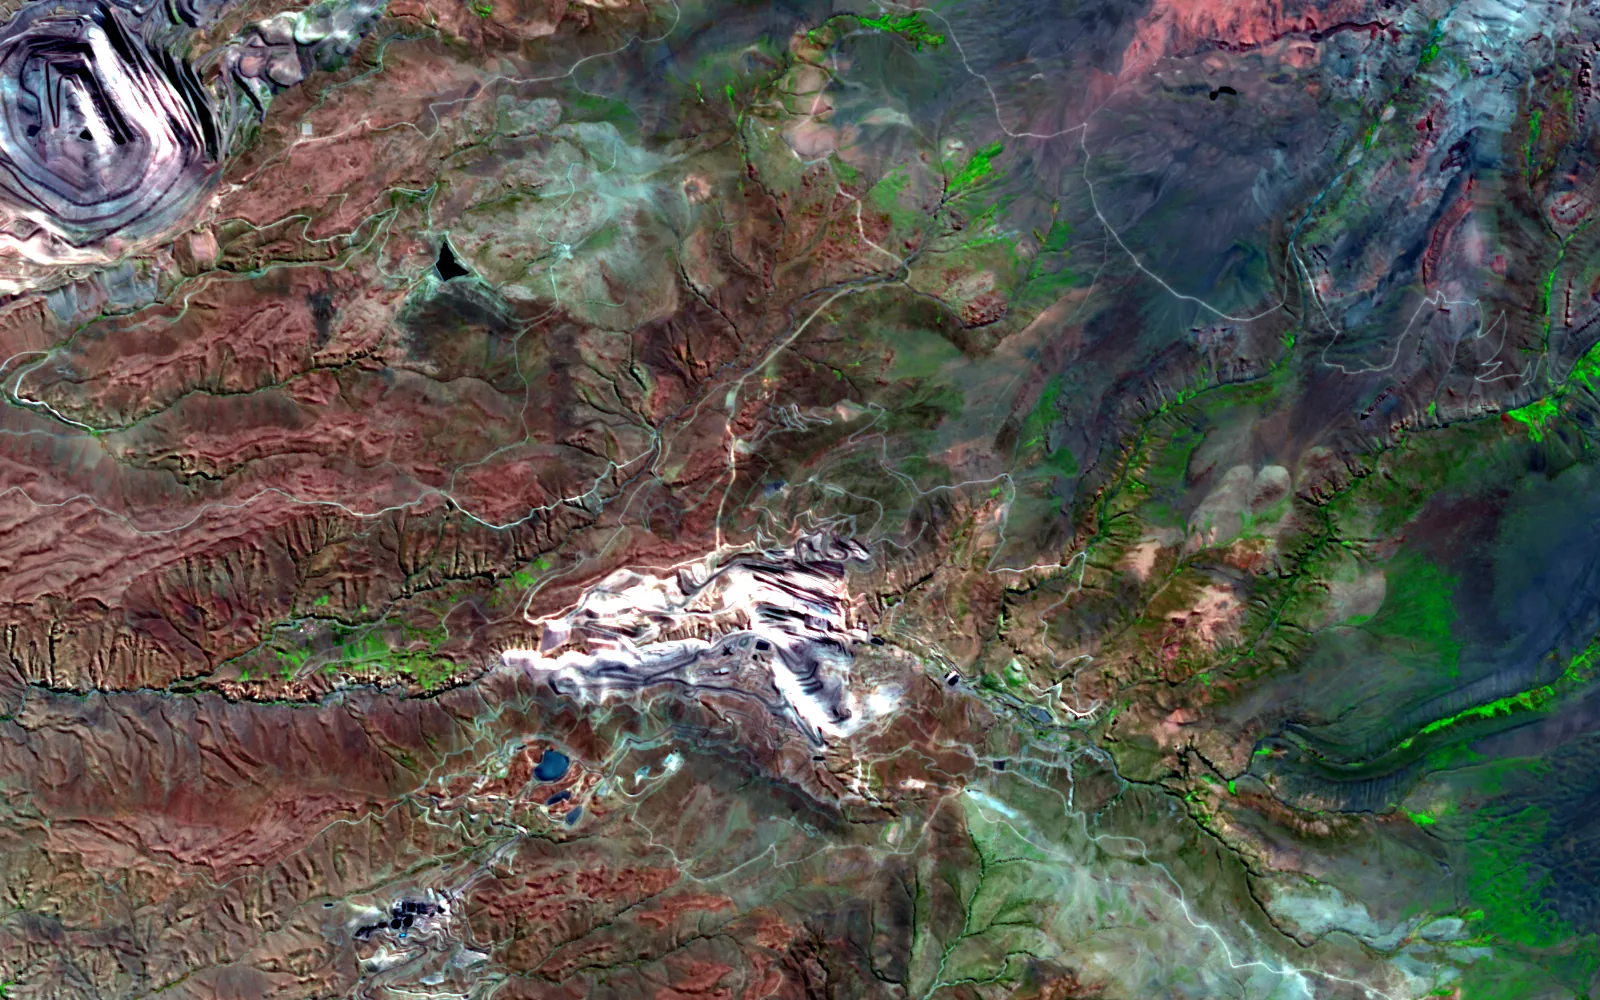 Shortwave2024
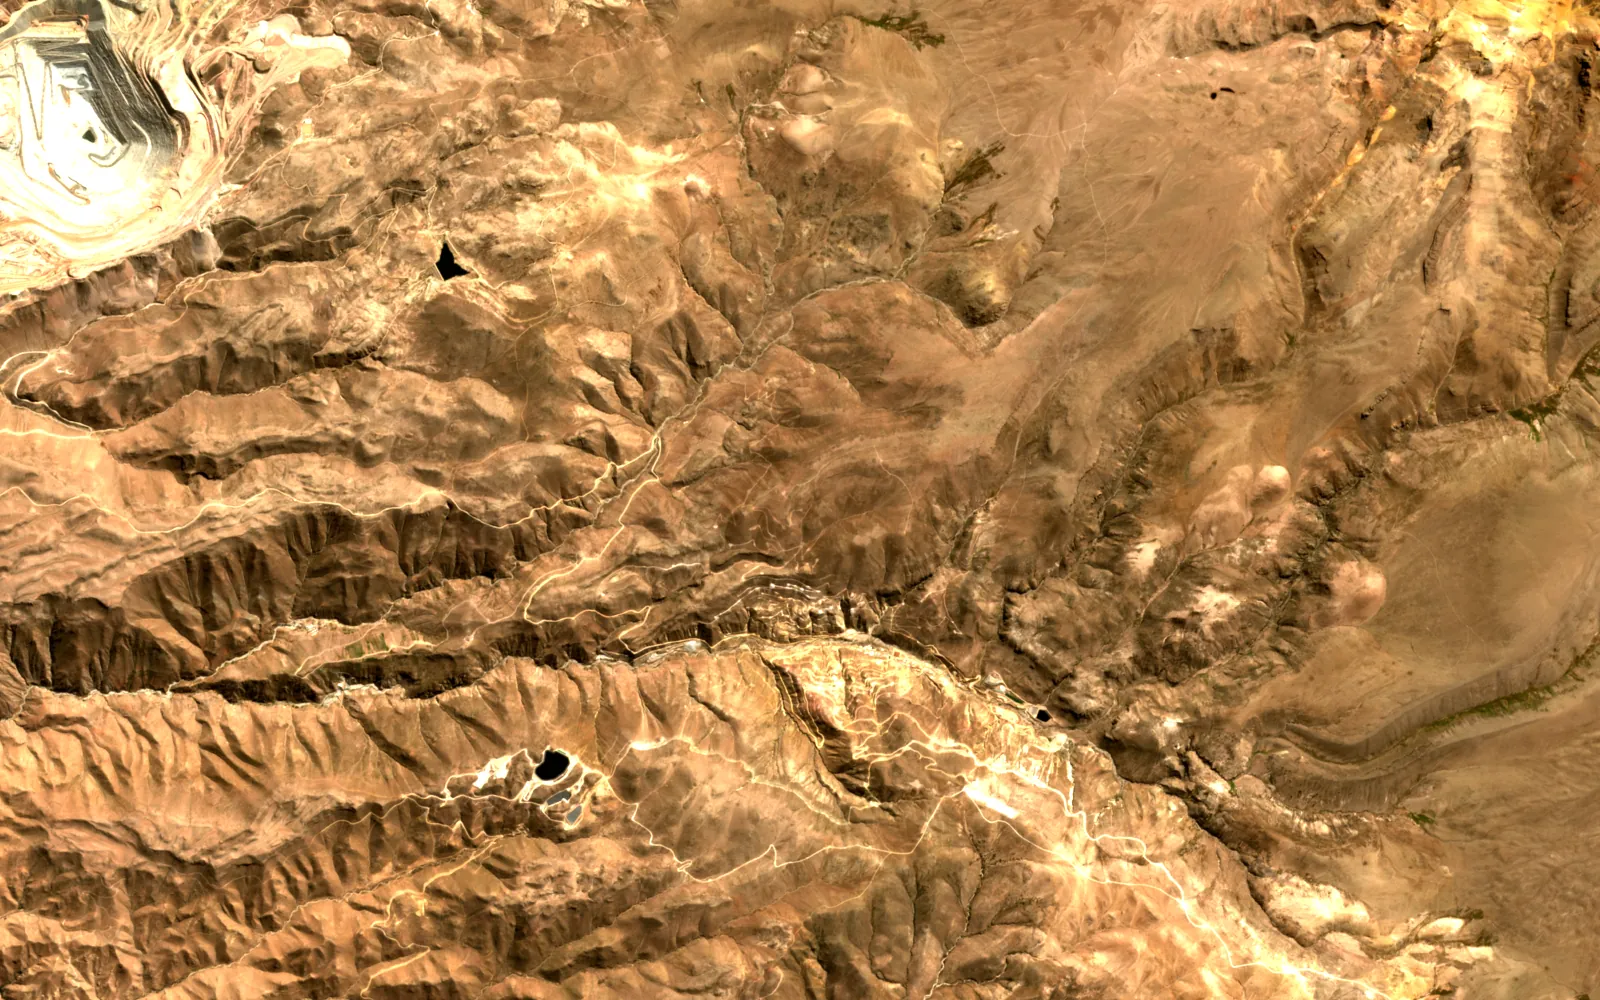 2017
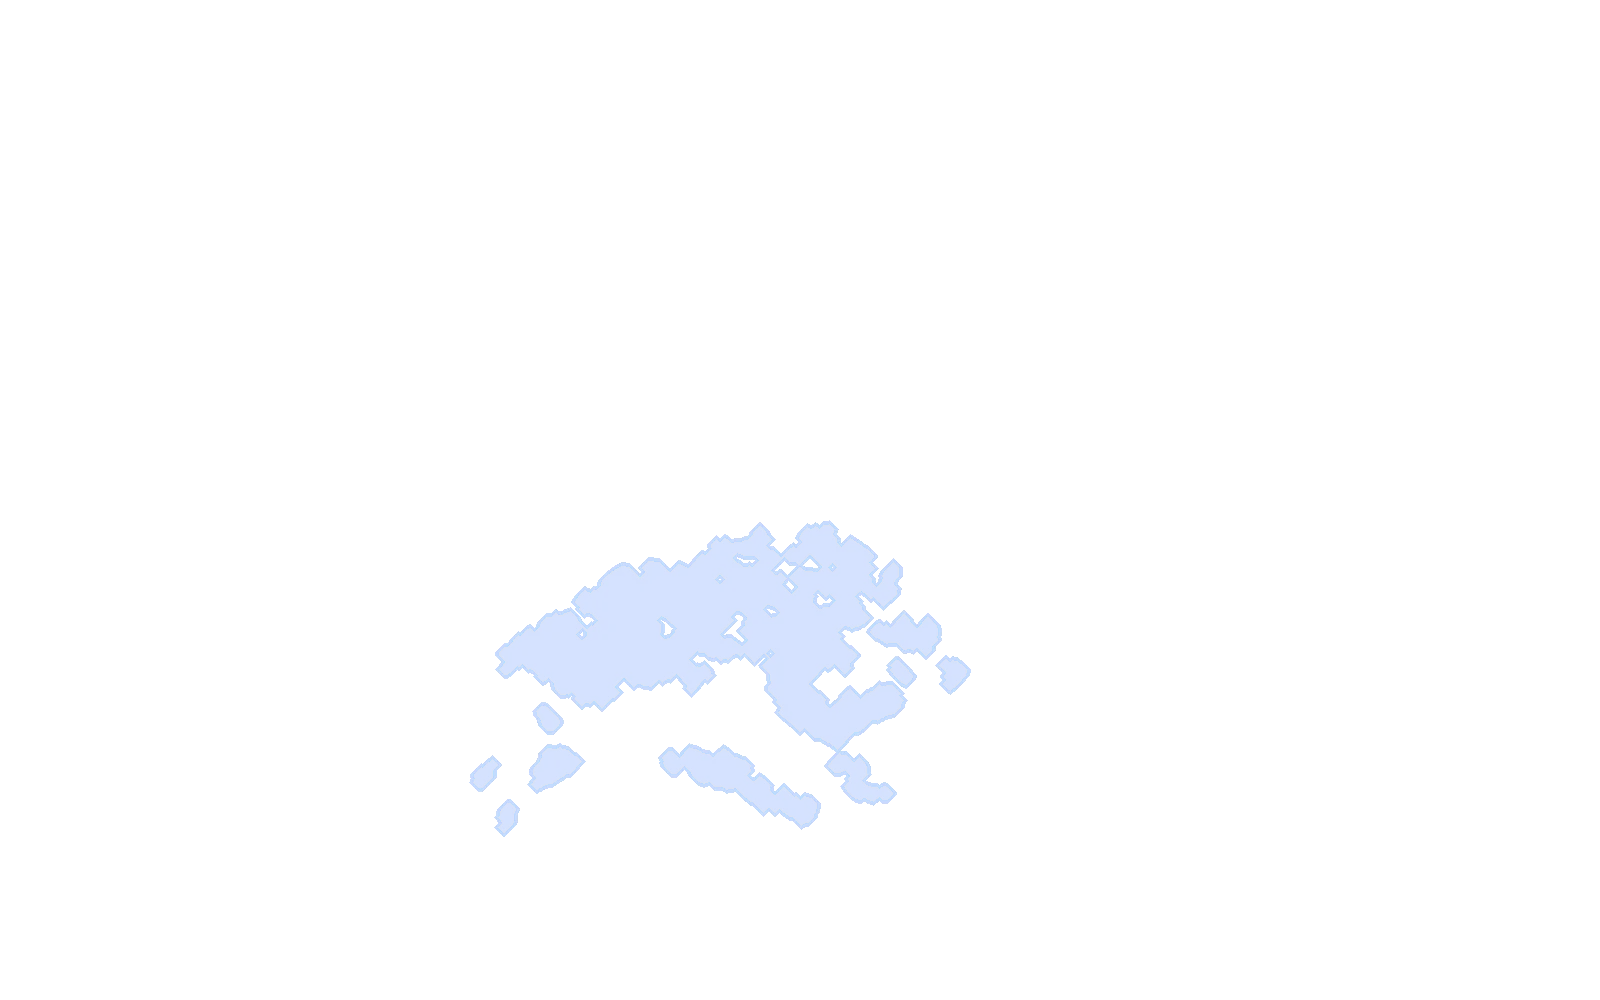
Contains modified Copernicus Sentinel data (2017, 2018, 2024). Copernicus DEM GLO-30, provided under COPERNICUS by the European Union and ESA.
Real
Every layer is public satellite or elevation data, processed by a script in this site's repository. The change map and the flag are computed, not drawn.
Illustrative
The district is a public example, not a client site. The pipeline here is a simplified stand-in for the product engine, and nothing on this page was checked against ground truth.
Each product below works on mining today. Atlas is the engine they share.
Change, encroachment outside the permit, plan against actual footprint, and stockpile volumes from radar and terrain.
The land suite. MineScope, AgriScope and ForestScope ship inside it.
OpenThe engine under every product: fusion, registration, detection, and an agent on the map.
OpenNumbers from real runs, each with the caveat it needs. Nothing here is a claim the run did not make.
Atlas change detection, one run. Largest 483.64 ha, median 0.11 ha.
A count from an ablation, not an accuracy figure.
Two independent methods at a South American mine. No ground truth yet.
Open any part for the method, the numbers and where to read more.
Before and after are cut into tiles at three scales and passed through the same frozen DINOv2 backbone. A small head reads the difference.
Pixel difference, structural similarity and edges run beside it and always return a map. Where the learned score is unsure, the weight leans on the classical one, so the polygons stay clean on a site the model has never seen.
A CLIP pass proposes a name for each polygon from a prompt registry, zero-shot.
Backbone
DINOv2 ViT-B/14, frozenLabels
CLIP ViT-B/32, zero-shotMean confidence
30.2%, the honest mid bandOn a public mine, one run gave a net land-use change, a comparison of the planned quarry footprint against what was actually disturbed, encroachment flags outside the boundary, and cut and fill volumes from two radar epochs.
These are readings, not validated results. No ground truth was available for that site.
Plan against actual
541 planned, 227 disturbed acresEncroachment flags
167Radar volume
+4.78 Mm³ cut, −2.91 Mm³ fillAt a South American mining operation, a hybrid of radar and elevation estimated about 276,000 m³ across four stockpiles. The radar method alone read 270,000 m³ and the terrain method 285,000 m³.
Survey ground truth has not been compared yet, so the number is a cross-check, not an accuracy.
Mining
Product screens from the cleared bundle. Names and accounts are painted out.
Public figures on the size of the problem.
About 1.4 trillion litres of oil sands tailings were in storage as of 2023, and every planned release will need monitoring that can be verified.
Source: industry research (Alberta Energy Regulator)Mining · Next step
Send an area and a question. I will say what the sensors can and cannot answer before anyone builds anything.