The stack
One valley, seven summers apart.
Managed coastal forest on northern Vancouver Island: 250 km² on one 12.5 m grid, read by optical, shortwave, radar and terrain.
Sentinel-2 · Sentinel-1 · Copernicus DEM
Industry · Forestry
Harvest, regrowth, biomass and carbon from the same imagery. ForestScope finds what was cut since the last look, draws each block as its own polygon, and sends the ones worth checking to a forester.
50.30° N · 126.69° W · 250 km²
The stack
Managed coastal forest on northern Vancouver Island: 250 km² on one 12.5 m grid, read by optical, shortwave, radar and terrain.
Sentinel-2 · Sentinel-1 · Copernicus DEM
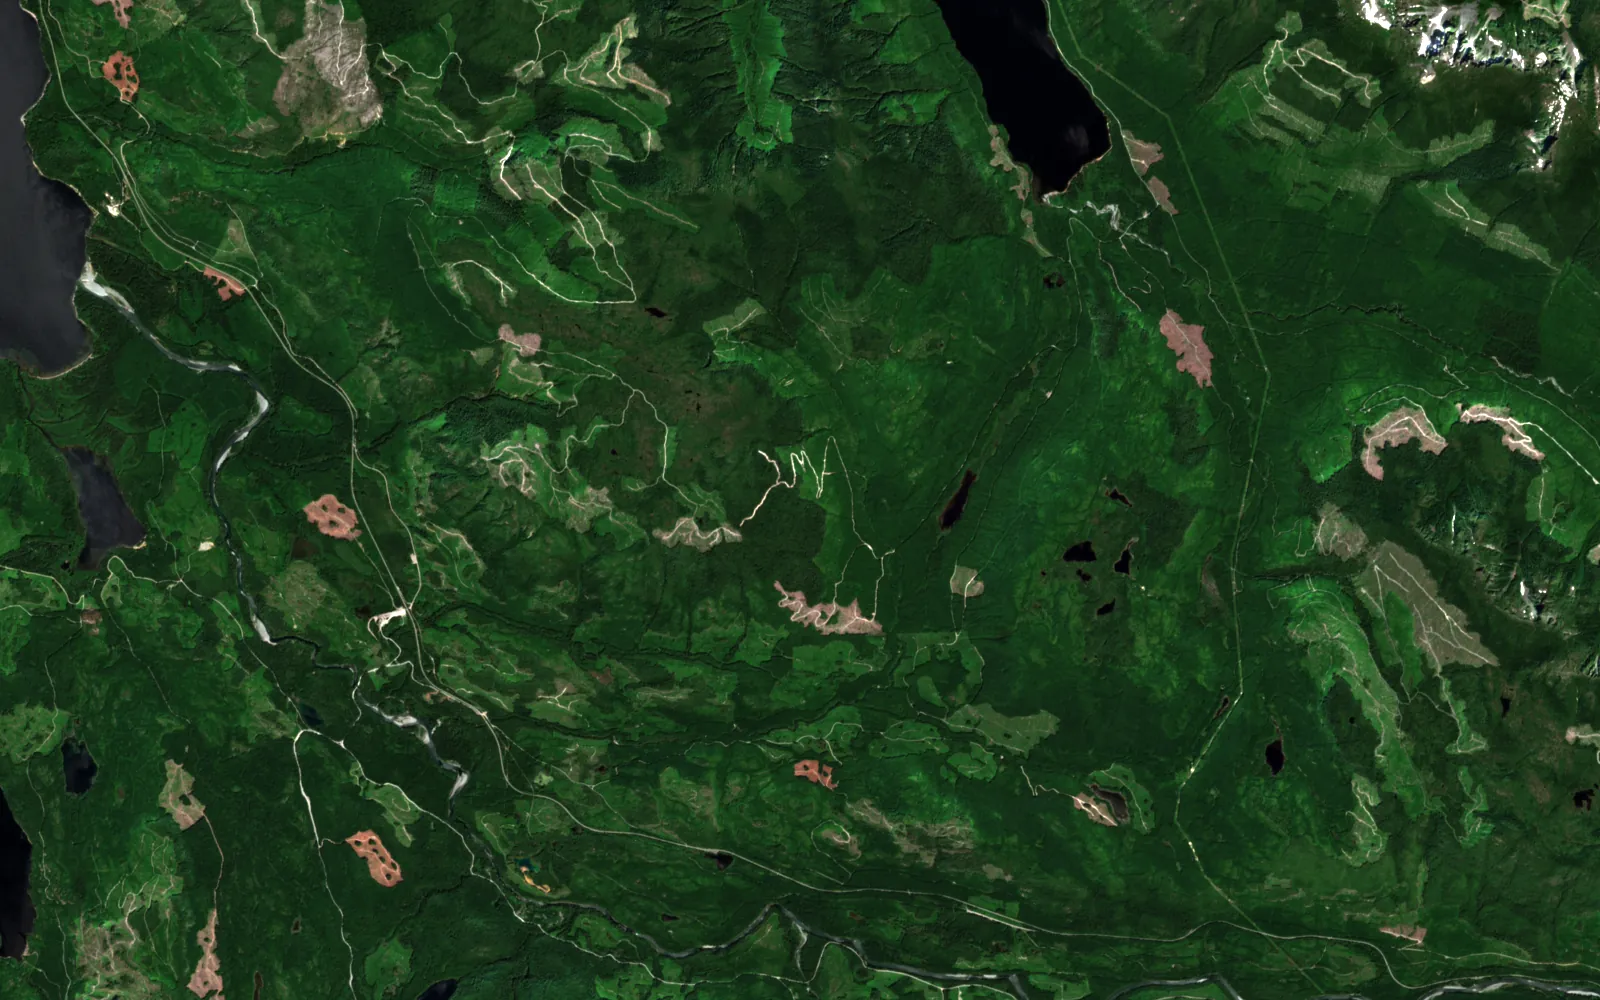
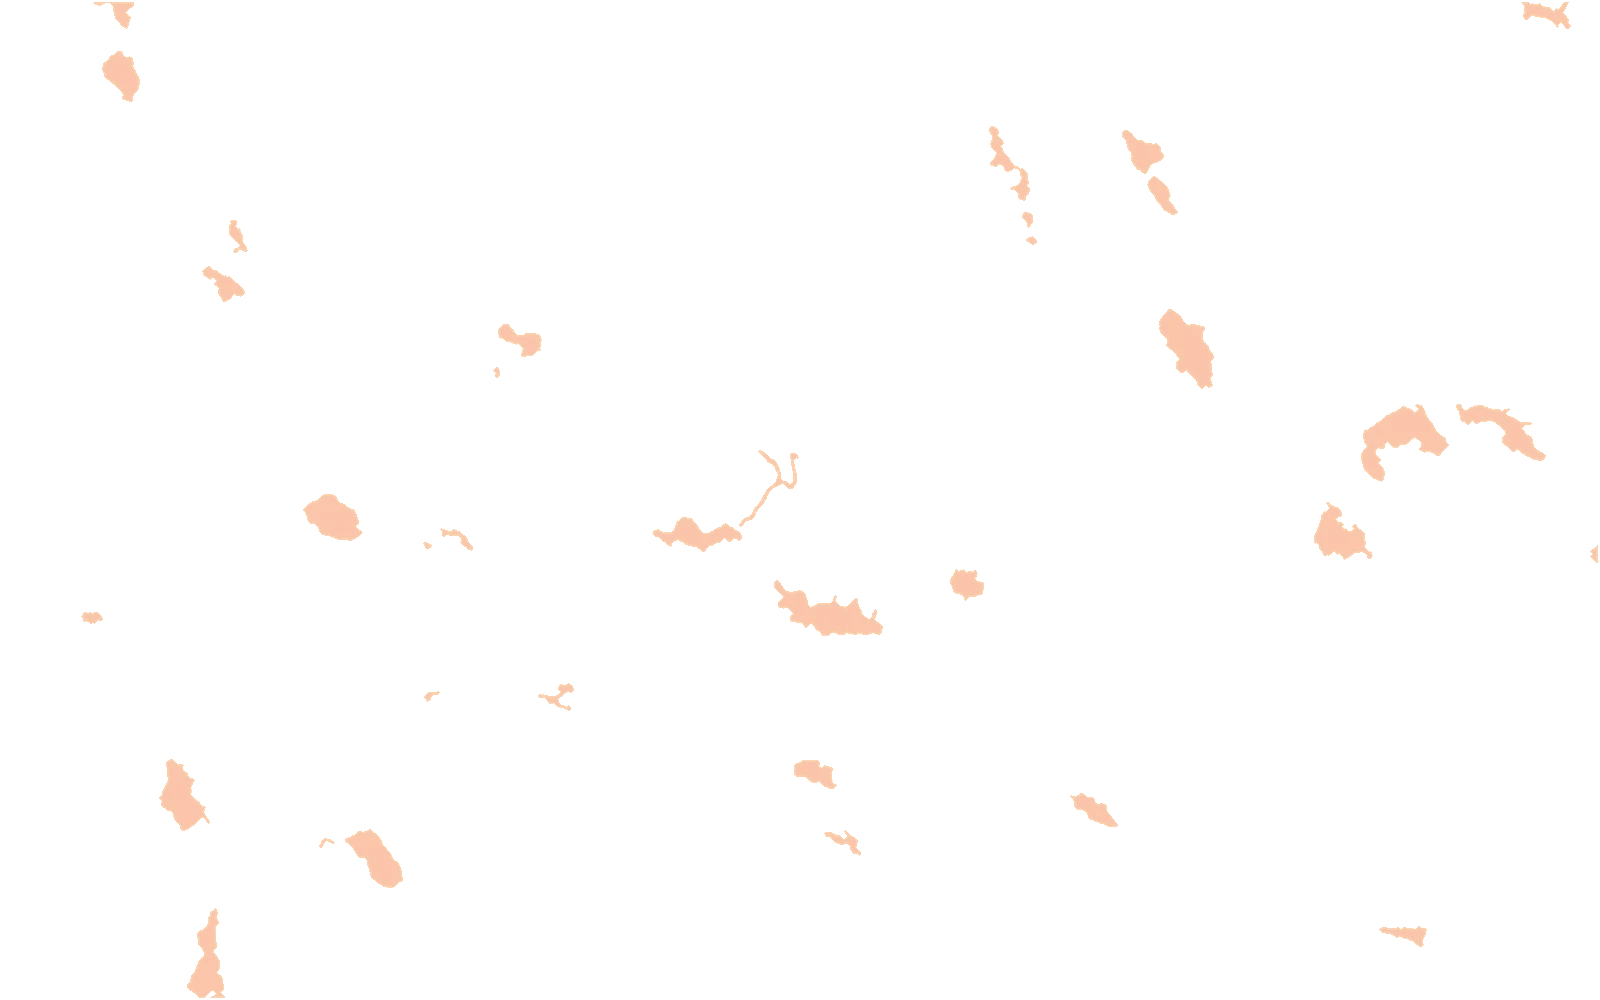
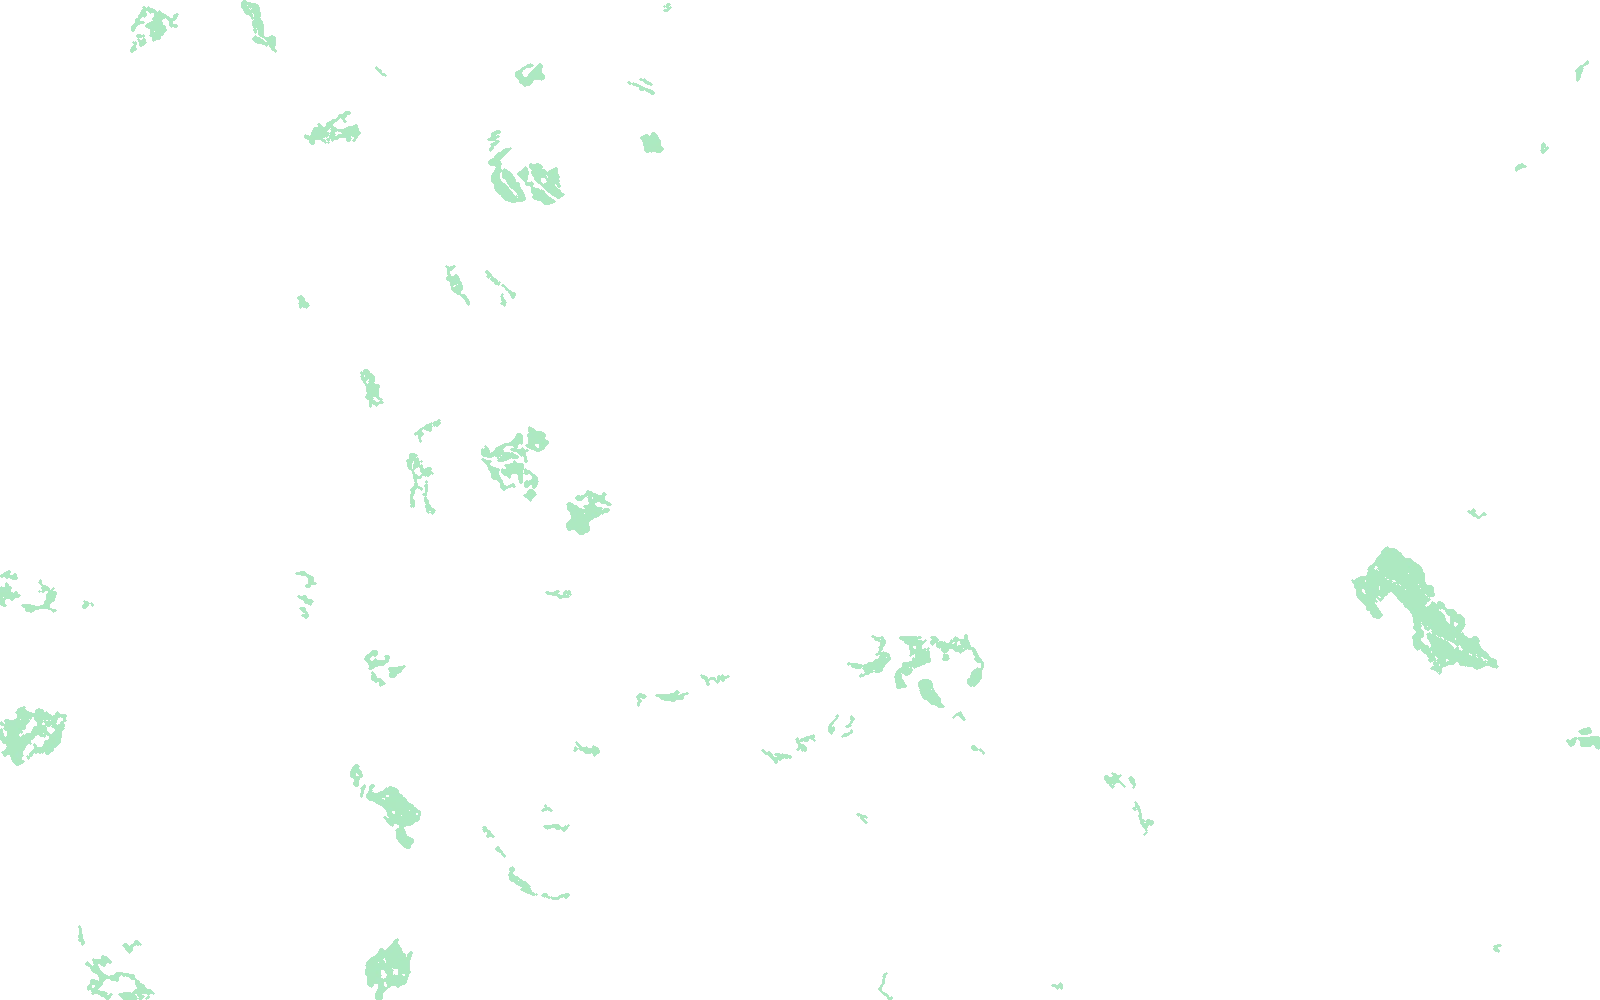
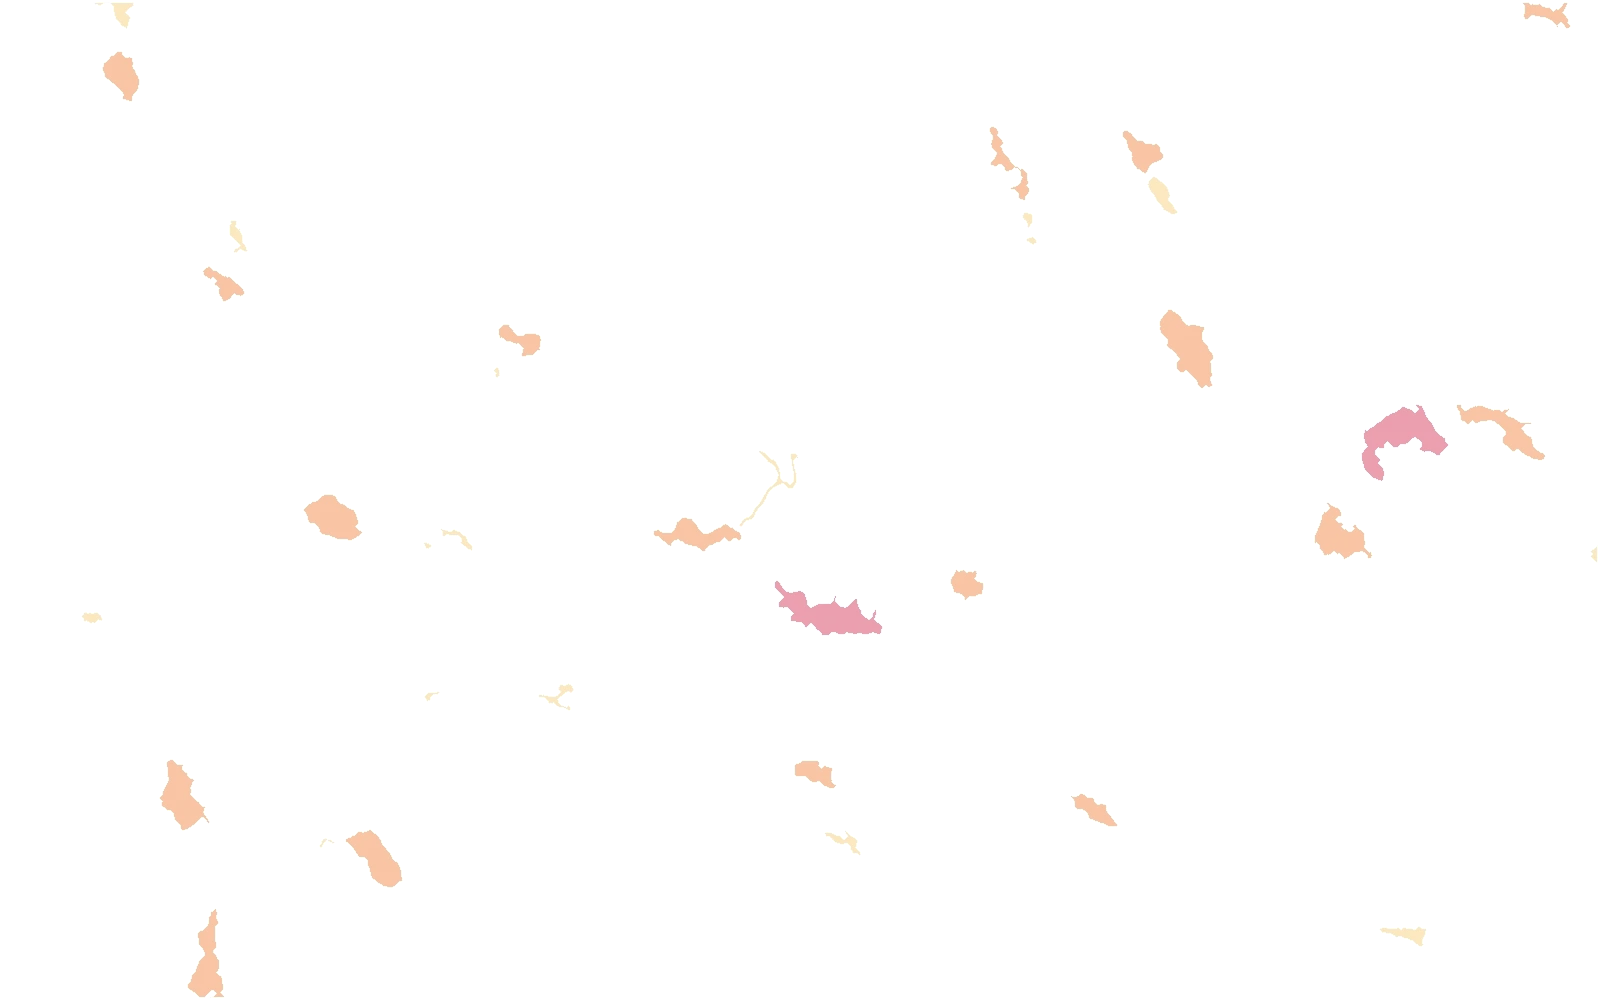
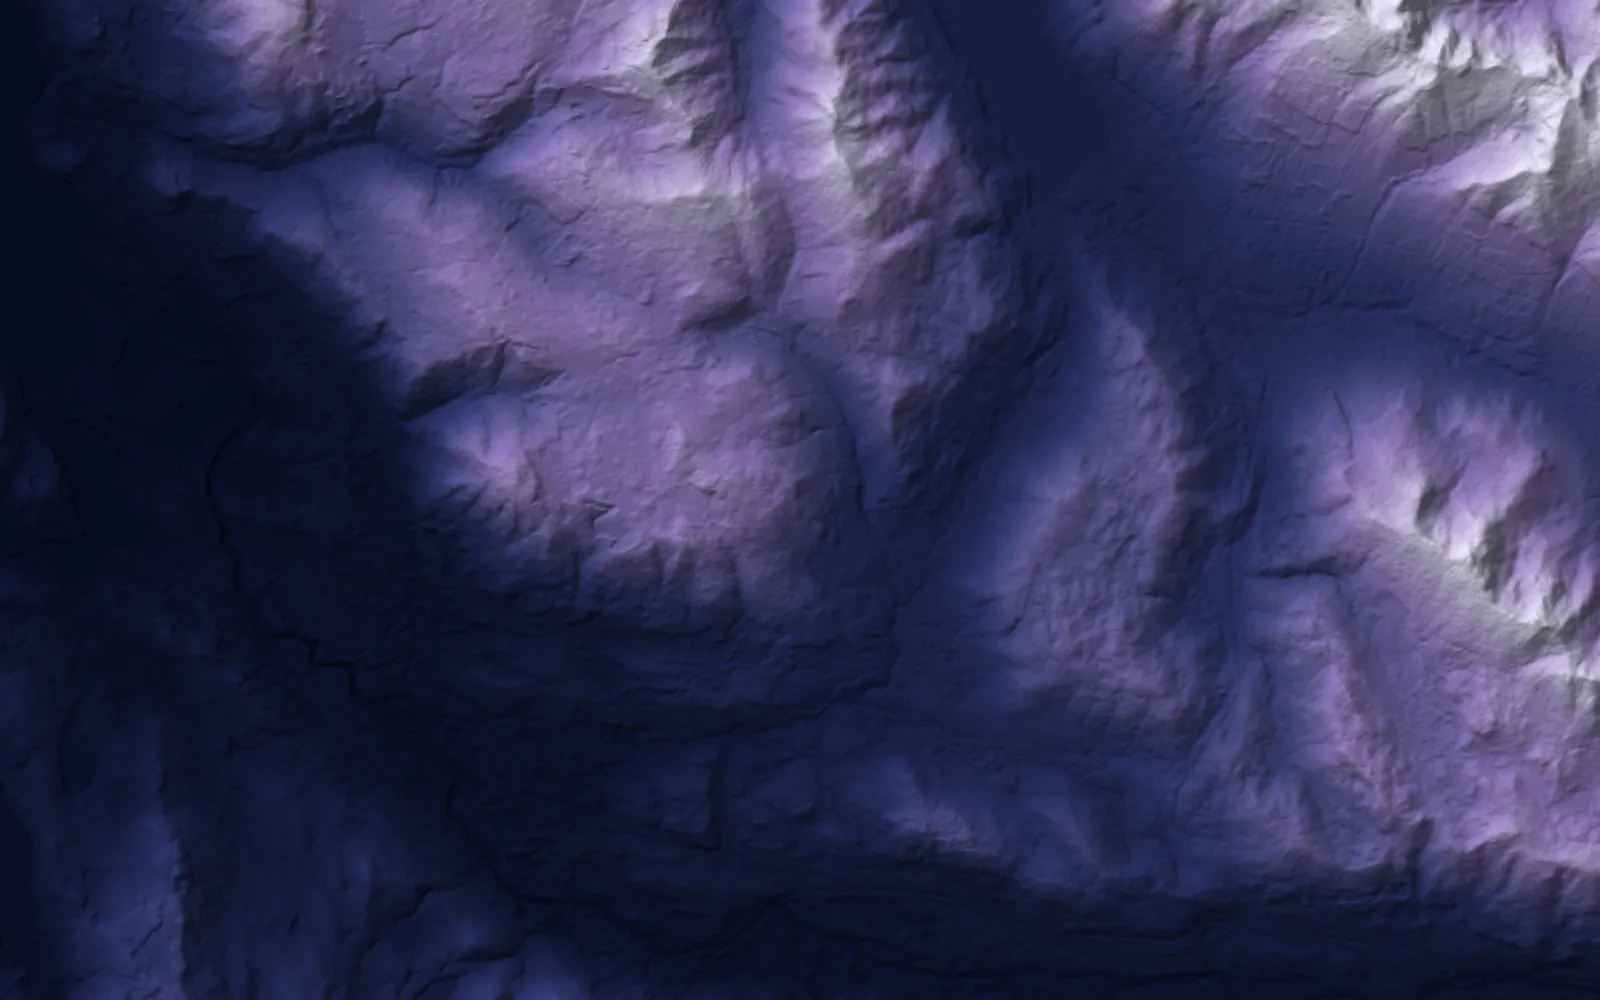 Terrain
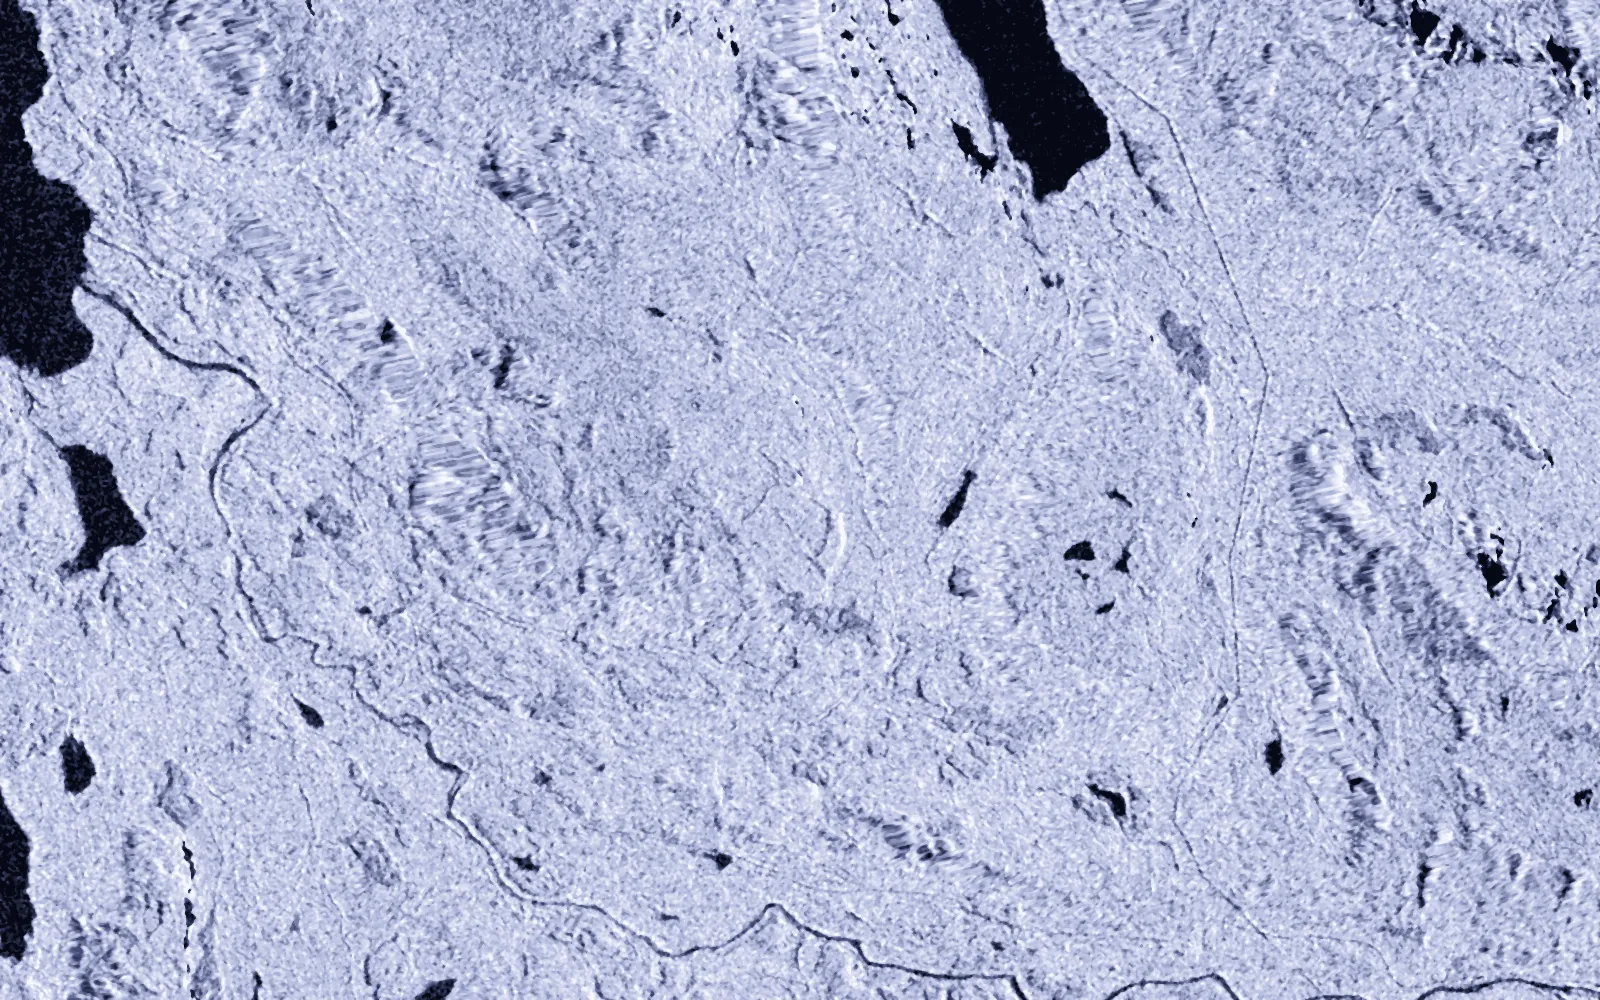 Radar
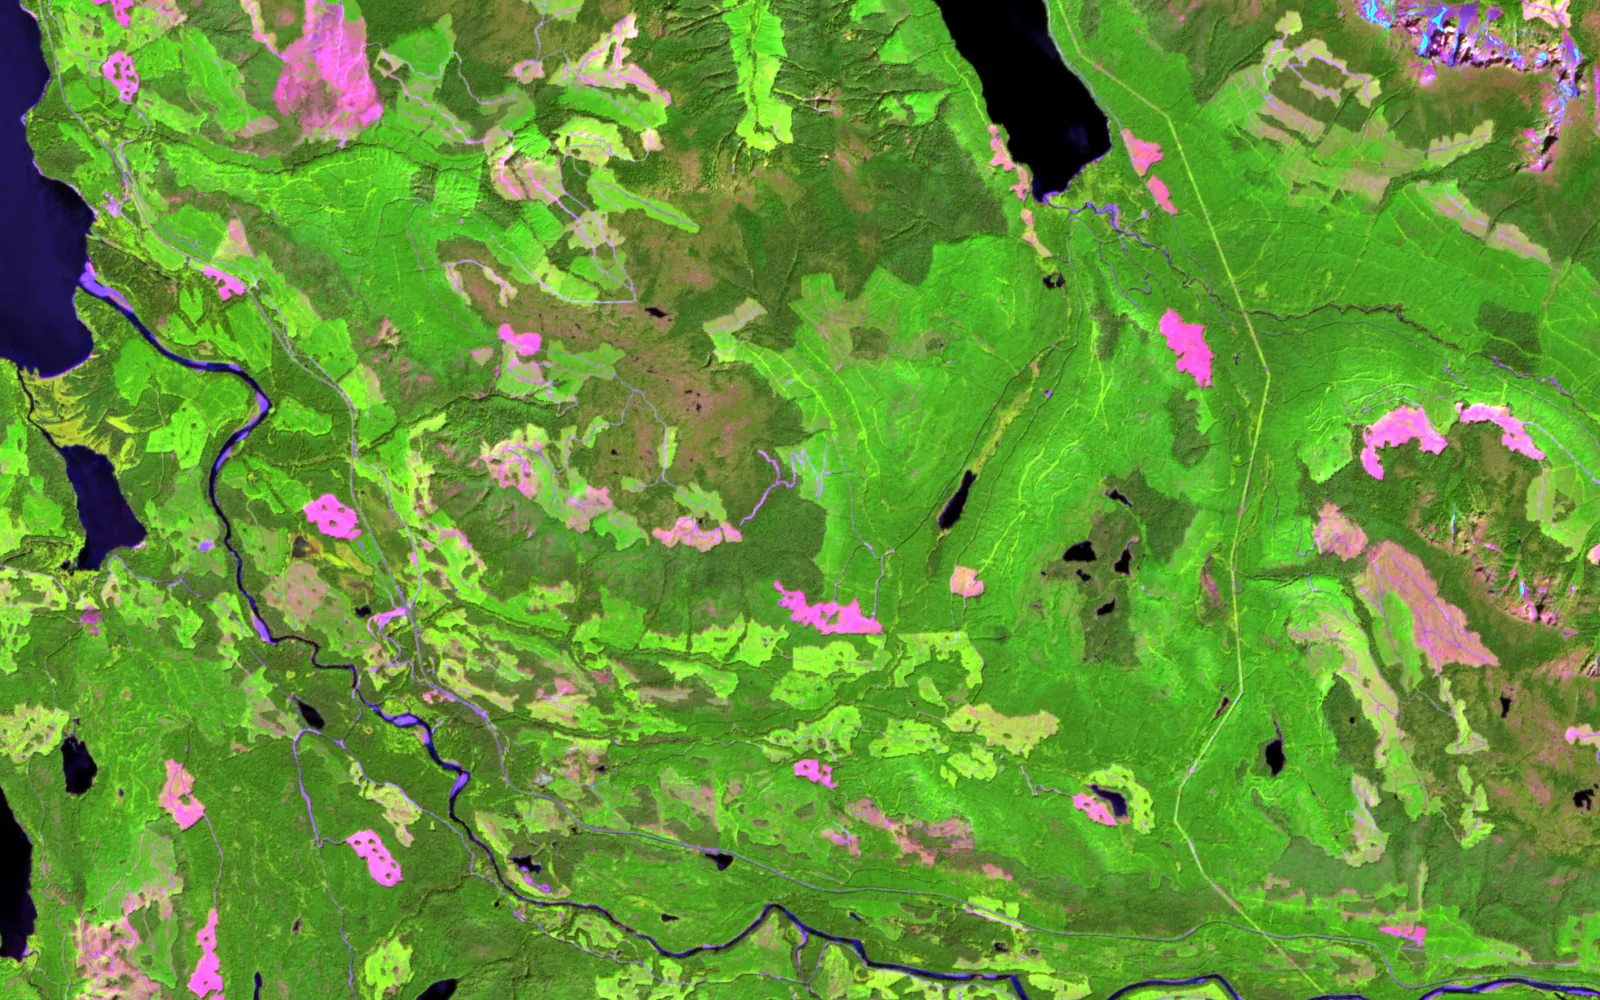 Shortwave2024
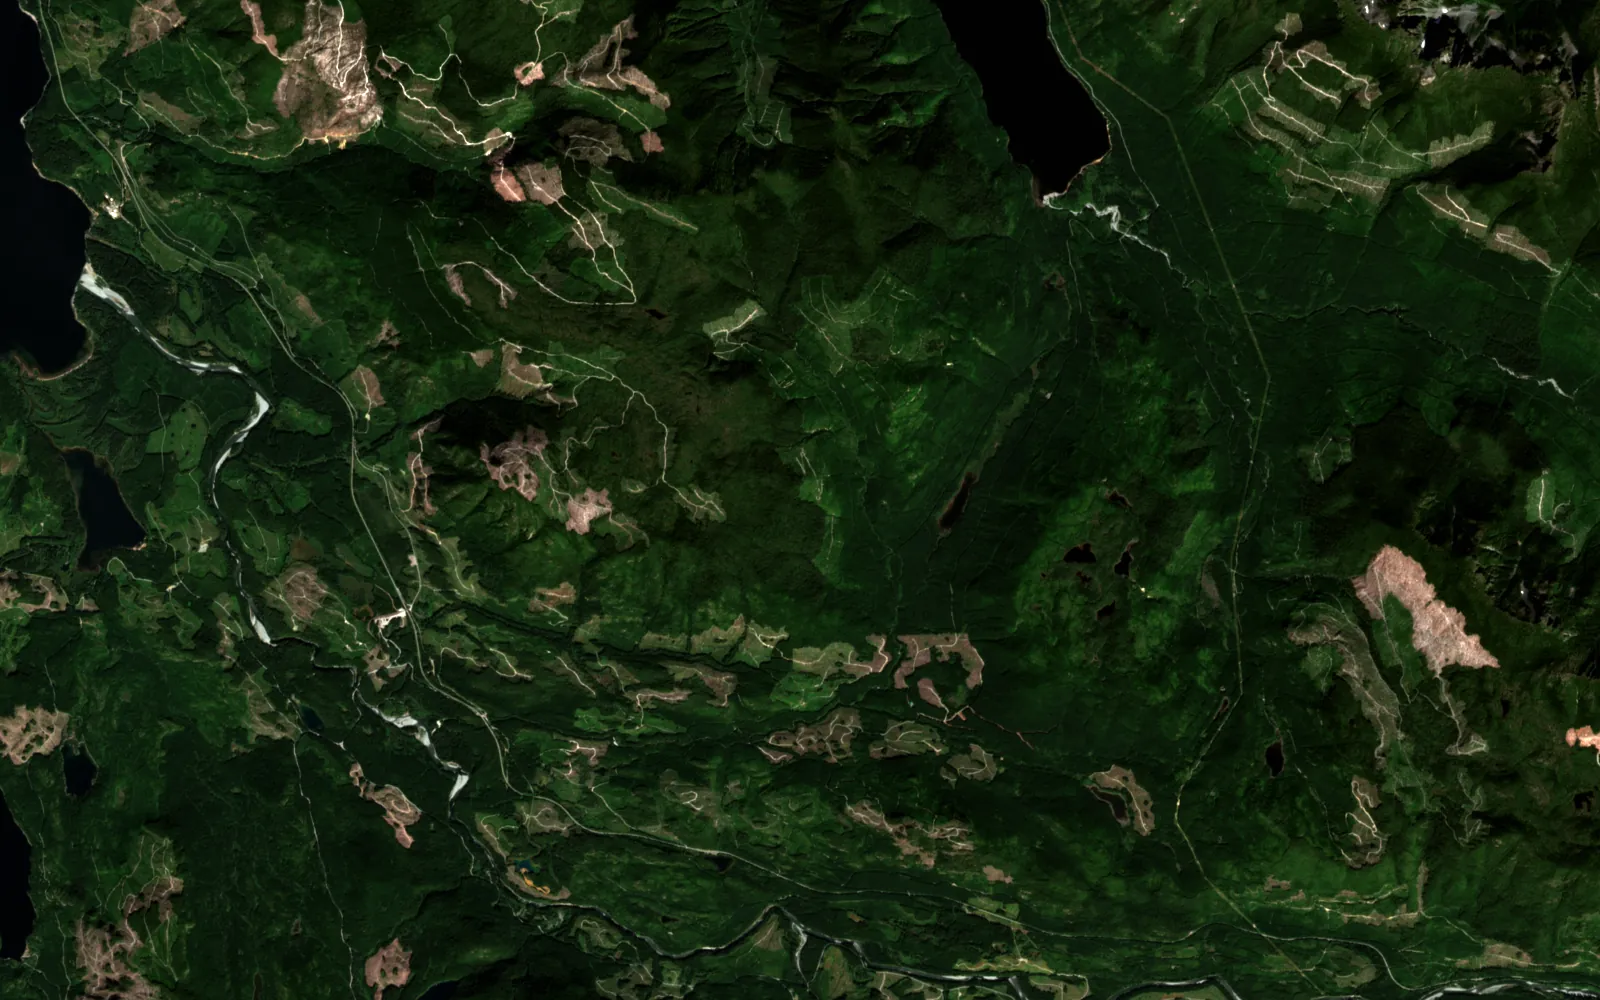 2017

Contains modified Copernicus Sentinel data (2017, 2024). Copernicus DEM GLO-30, provided under COPERNICUS by the European Union and ESA.
Real
Every layer is public Sentinel-2, Sentinel-1 or Copernicus terrain data over a public managed forest. The blocks, regrowth and the flagged block are computed by a script in this site's repository.
Illustrative
This valley is a public example, not a client. Checking the block against the approved cutblock is the action a forester would take next, not a finding about any operator.
Each product below works on forestry today. Atlas is the engine they share.
Harvest and regrowth, biomass and carbon, and the fire risk read before the season.
The land suite. MineScope, AgriScope and ForestScope ship inside it.
OpenTwo dates, three signals, one polygon per change, each with an area and a reason.
OpenThe engine under every product: fusion, registration, detection, and an agent on the map.
OpenUse cases
Numbers from real runs, each with the caveat it needs. Nothing here is a claim the run did not make.
Computed on this page from public imagery. Each block is a polygon with its own area.
Canopy lost and canopy coming back, so a replanted block is not mistaken for a new cut.
Every layer is warped to the same 12.5 m cells before anything is compared.
Open any part for the method, the numbers and where to read more.
Canopy is compared only where there was closed forest to lose, so a harvested field or a drained pond does not count. Loss is grouped into connected blocks, holes are filled, and each block gets an area, a slope and a size class.
The same pass reads regrowth on ground that was open, which is how a replanted block stays separate from a new one.
ForestScope · Design
Claude Design captures of the ForestScope steward dashboard: health, carbon and fire, hazard zones and habitat. Every figure on these screens is sample data, not a result.
Public figures on the size of the problem.
Canada holds about 9% of the world's forests.
Source: industry research (Natural Resources Canada)Forestry · Next step
Send an area and a question. I will say what the sensors can and cannot answer before anyone builds anything.